Data Visualization, Data Science and AI by Alan Jones


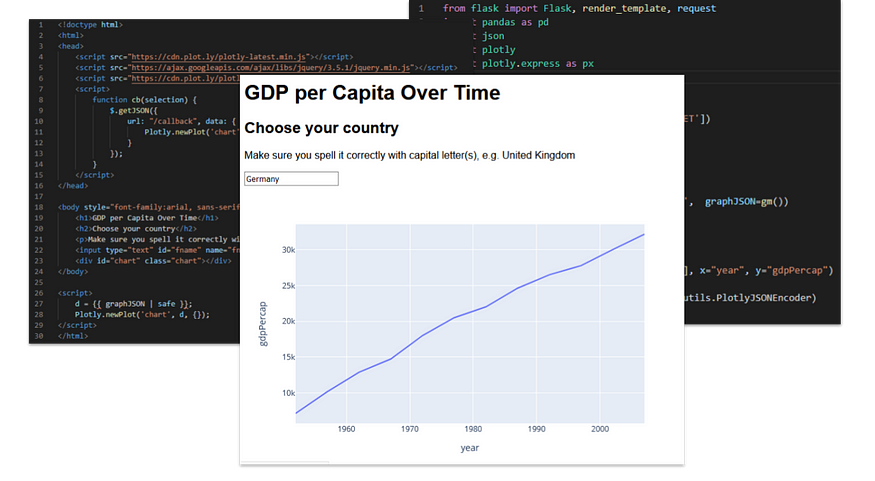
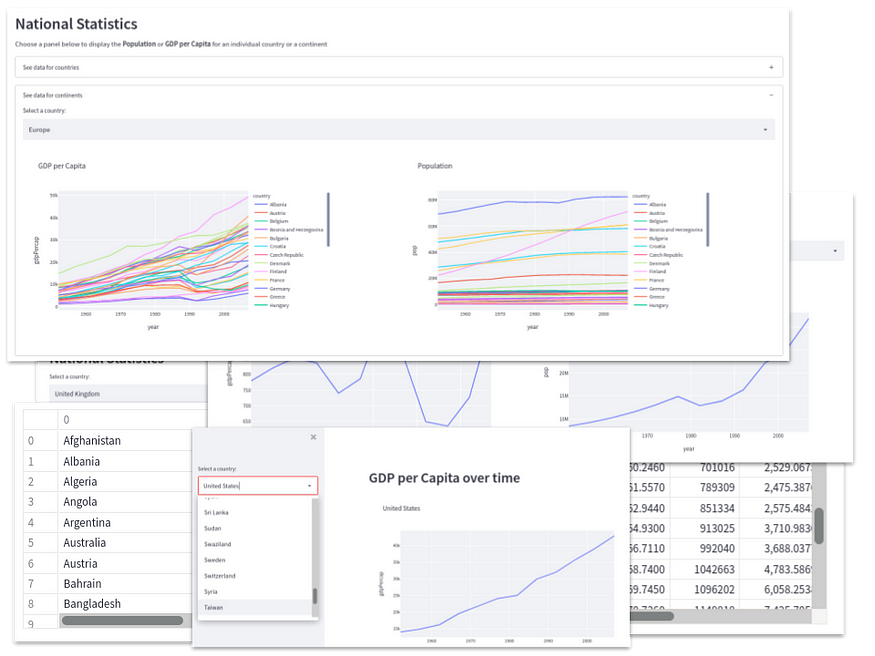
Data Visualization and AI apps for the web using Streamlit, Plotly, Python and Flask. See the articles/tutorials, below - many have the example code on Github.

Articles

Sponsored content
eBook

Streamlit from Scratch

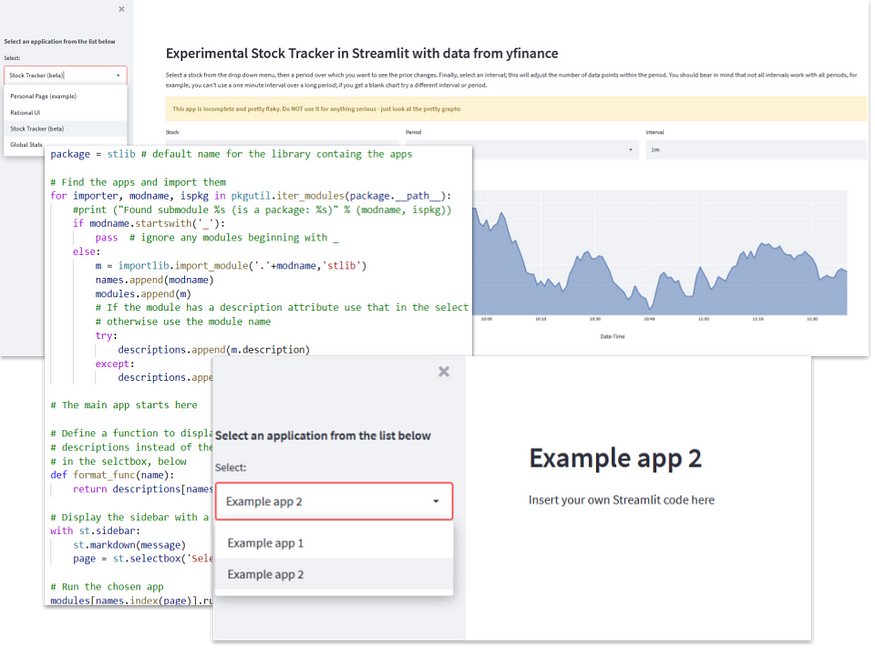
Streamlit is a framework for creating Data Science apps in Python.
Streamlit from Scratch is an ebook that will teach you how to get started with Streamlit.

Sponsored content
How Charts Work: Understand and explain data with confidence
From the Back Cover

How Charts Work brings the secrets of effective data visualisation in a way that will help you bring data alive. Charts, graphs and tables are essential devices in business, but all too often they present information poorly. This book will help you:

  • Feel confident understanding different types of charts, graphs and tables – and how to read them
  • Recognise the true story behind the data presented and what the information really shows
  • Know the principles and rules of how best to represent information so you can create your own information-driven (and beautiful) visuals
  • Design visuals that people engage with, understand and act upon
  • Sponsored content
    The Art of Statistics: How to Learn from Data
    Discover how data literacy is changing the world and gives you a better understanding of life's biggest problems. I have used this book in various articles and found it to be invaluable.
    eBook
    Plotting with Pandas

    Plotting with Pandas: an Introduction to Data Visualization is an ebook that covers basic and statistical plots using Python and Pandas, line and bar charts, scatter plots, pie charts, histograms, box plots, etc.

    Sponsored content
    Storytelling with Data: A Data Visualization Guide for Business
    Don't simply show your data - tell a story with it! Storytelling with Data teaches you the fundamentals of data visualization and how to communicate effectively with data. I use this book in the series of articles '12 Essential Visualizations and How to Implement them.
    Sponsored content
    How Charts Lie: Getting Smarter about Visual Information
    A leading data visualization expert explores the negative - and positive - influences that charts have on our perception of truth. I used this book as the inspiration for 'How Not to Lie with Charts'.

    subscribe via RSS